LogView Studio offers a lot of different measuring functions for charts. These can be selected with the Menu 'Chart' -> 'Measure':
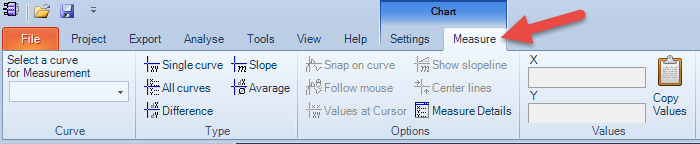
To start or stop the measure function it is just needed to select a curve and the type of measuring.
Following options are available:
| • | Single Curve Only one curve will be measured.  |
| • | All Curves All displayed curves will be measured. There is only one vertical measuring mark which can be moved with the mouse.  |
| • | Difference With two cross hairs a differential measure can be done. 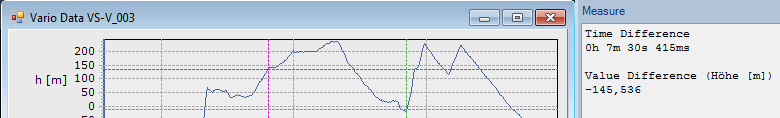 |
| • | Slope With the two cross hairs the gradient (slope) of the curve can be calculated. 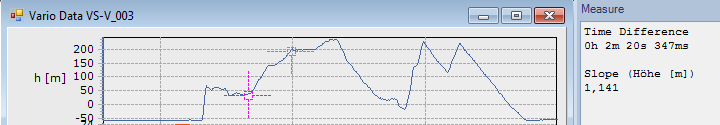 |
| • | Average An average value between the two markers is calculated. 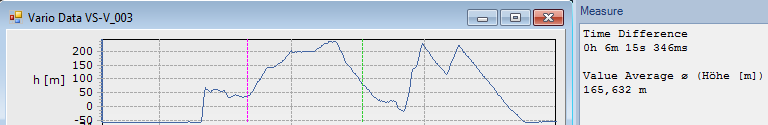 |
With 'Copy Values' the measured values can be copied to the clipboard anytime.