In this chapter we like to explain in short words how to create a project in LogView Studio, how to add a device, how to configure a device and how to start logging in order to create a graph at the end. Hereby we only show parts of the powerful options which are possible with LogView Studio.
Tip
The following documented Quickstart show in general the function of LogView Studio. If you are familiar with the previous LogView V2 you should not have any problems with the following demonstration and the functions of LogView Studio.
Generally we highly recommend to read all the additional information about LogView Studio carefully to understand the full functionality.
Requirements
| • | .Net Framework 4.0 Full must be installed |
Start LogView Studio
| • | Start LogView Studio from the Windows Startmenu or start 'LvGui.exe' directly. |
| • | It may happen that Firewall dialog windows appears on the screen where access to the private network shall be granted. |
| • | Now LogView Studio should appear on the screen with a 'LogView Studio Quick Start' dialog window. |
New Project
Click 'Start a new Project' inside the Quick Start Dialog

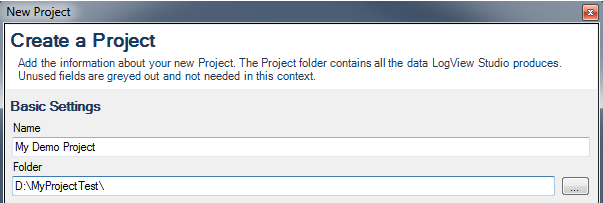
In the following window 'New Project' enter a Project Name and Folder as location where the project shall be created and saved. Press 'OK' to proceed creating the new Project.

Important Note
The Project Folder must be a new one which is not yet present. LogView Studio will create this folder itself.
Under certain conditions again a Firewall dialog window may appear.
After successfull creation of the Project you should see in the left side window 'Project Explorer' only one entry called 'Garbage'.
Add Device
Next step is to add a device you want to read data from and/or process such data.
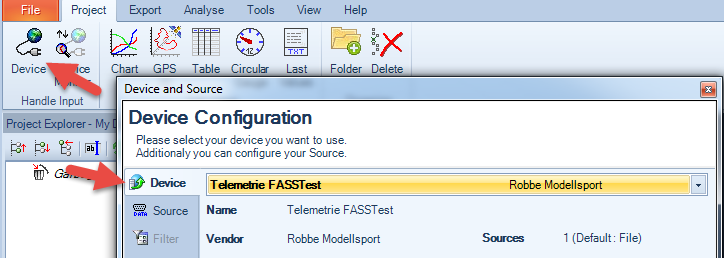
Select from the Main Menu 'Project' and click in the 'Handle Input' section on 'Device'.

In the following 'Device and Source' Configuration Dialog you can select the device of your choice. (Note that here only those devices are available which have been installed during the first main Installation of LogView Studio. If you need to add other devices you must run the Update procedure.)
Confirm with 'OK'. Now the new device will be added to the previous created Project.

Note
We showed this intentionally without Configuring the source.
Normally you can configure Device and Source in one step.
Configure Source
Now the Source (data-source) must be configured for the device. LogView Studio is able to handle a various amount of different data sources like serial, HID, TCP, UDP, Files. Which type of sources are finally available to be configured depends on the selected device. Example: In case of a FASSTest telemetry only Textfiles can be used as source.
With double click on the source 'Telemetrie FASSTest" inside the Project Explorer the 'Device and Source' Configuration Dialog window will appear.

As this device only supports one source 'File' no other type of sources are available. In case a device supports more than one type of sources you can select one source here which will be used for this device.
Confirm the Dialog with the 'OK' button and the data import will be started.
Note
Only text and binary files will be read immediately after closing the dialog window. All other type of sources must be started individually by selecting the Checkbox beside the device inside the Project Explorer Tree.
![]()
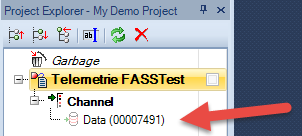
After completing the data import or after starting the device with the Checkbox new elements will appear in the Project Explorwer - the data records.

The data records are representing a collection of data within the database. And in a different way from LogView V2 there will NOT be created a related graphic immediately.
How to create a graphic from a data record will be shown further down.
Import further datafiles
In case you want to import further datafiles for a specific device you can also use the Drag and Drop function to move them from the Windows File Explorer to the relevant device in the Project Explorer of LogView Studio. The data import and processing will start immediately.
Create static Chart
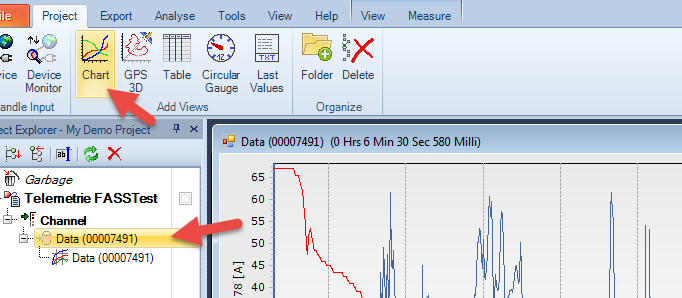
To create a static chart of a data record mark the relevant data record and then go to the Main Menu 'Project' section 'Add Views' and click on 'Chart'.

Now the selected data record will be shown in a static Chart.
Using the window 'Chart Control' and the menu 'Chart' the graphic can be configured to your own preferences.

Display Live Data
Beside the static graphic (no further changes inside the graphic) LogView Studio can also display live data. This ia mainly interesting with devices which send continously data like battery charger or weather station sensors.
To achieve that you must select a channel of a device in the Project Explorer. Then by selecting 'Chart' or 'Circular Gauge' a Live chart can be displayed which is fed every x seconds with new data.
Load / Reload Project
A Project can be loaded in three different options:
| • | After starting LogView Studio inside the 'Quick Start' Dialog |
| • | using the List in File Menu |
| • | via File - Open Project ... |
Final Remarks
Maybe this Quickstart Introduction seems to be slightly complex on the first view. But once you have created your first project in LogView Studio and have used it you will find it more and more easy to handle. Additionally there are help texts in tool tips on almost all buttons in LogView Studio where the function of the specific button is explained. Within these tool tips you find also direct links to further information inside this Help File.