If you start recording data with LogView Studio you will notice that there is no visual display after start of recording / reading. The display of your choice has to be added first to a dataset or to a Channel within the specific Project.
Generally there are two different type of Views available:
Static Views
Static Views are created once for a specific dataset and will not change their values afterwards. (Only the graphical appearance can still be adjusted afterwards by the User.)
Live Views
Live Views are assigned to a specific Channel and they are reading intermittently and display the latest data from the database of the selected Channel.
Note for Live Views
Live Views must be activated (started) by the User similar as to be done with a device. In the Project Explorer window there is a checkbox on the right hand side of each Live View entry which can be used to start and stop the Live View thread. If it is not possible to start and stop these Live Views it may lead to a performance problem.
Sample Screen

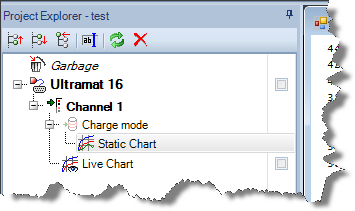
Inside this Project a device has been added (Ultramat 16) which has one Channel (Charge mode data line).
The device was activated earlier and has recorded the charge process into the self created dataset 'Charge Mode'.
In order to see the graphic of the received data there has been added a static View named 'Static Chart'. This chart contains all data of the related dataset. Once the Chart has been created the data will not be changed anymore by LogView Studio.
The Live Chart is assigned to a Channel. Here are displayed the latest received and stored data of Channel 1. The graphical display Live Chart will be updated continuously when activated (started). The display is slightly similar to an oscilloscope - but considerable slower.